Quick answer
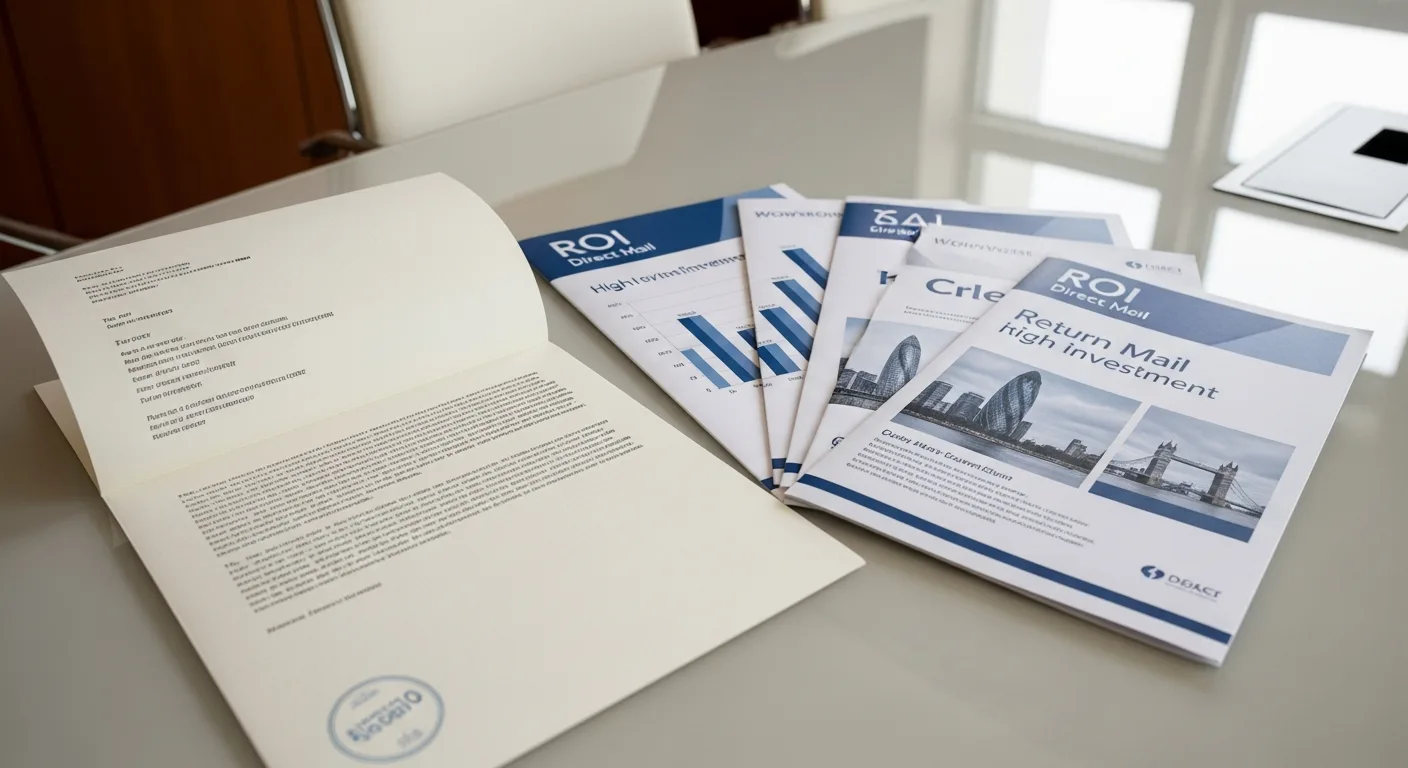
According to JICMAIL's Response Rate Tracker, which covers 4,939 measured UK campaigns (2023–2025 average), warm direct mail to existing customers or supporters averages a 6.3% response rate and £8.80 ROI per £1 spent. Cold direct mail to prospects averages 1% and £2.10, partially addressed mail 0.7% and £2.30, and door drops 0.3% and £4.00. Response rates for both cold and warm direct mail grew by more than 20% in 2025.
Key takeaways
- Warm mail responds at about six times the rate of cold mail: 6.3% against 1%.
- Sector makes a big difference. Warm charity mail averages 11.5%, while warm financial services mail averages 1.3%.
- Format matters too: A4 mailers achieve 2.7 times the response rate of postcards.
- Mail with both a brand and a response objective sees about five times the response of mail with one objective: 9.3% against 1.9%.
- Engagement goes beyond direct response. 9.5% of all mail items prompted a website visit in Q2 2026.
UK direct mail response rate benchmarks
The most reliable UK source is JICMAIL's Response Rate Tracker. It pools results from 4,939 campaigns run by fifteen participating organisations, measured through tracked responses and matchback rather than surveys.
| Mail type | Average response rate | Average ROI per £1 |
|---|---|---|
| Warm direct mail | 6.3% | £8.80 |
| Cold direct mail | 1.0% | £2.10 |
| Partially addressed mail | 0.7% | £2.30 |
| Door drops | 0.3% | £4.00 |
Door drops show a low response rate but a healthy ROI because they cost so little per household. JICMAIL reported that door drop ROI nearly doubled to £5.28 in 2025 alone.
Response rates by sector
| Sector | Cold direct mail | Warm direct mail |
|---|---|---|
| Charity | 0.7% | 11.5% |
| Financial services / insurance | 0.8% | 1.3% |
| Retail / online retail | 0.8% | 3.7% |
| Mail order | 1.3% | 8.0% |
| Magazine publisher | – | 6.7% |
| TV / broadband | 0.8% | – |
| Medical | 0.4% | – |
| Travel | 0.4% | – |
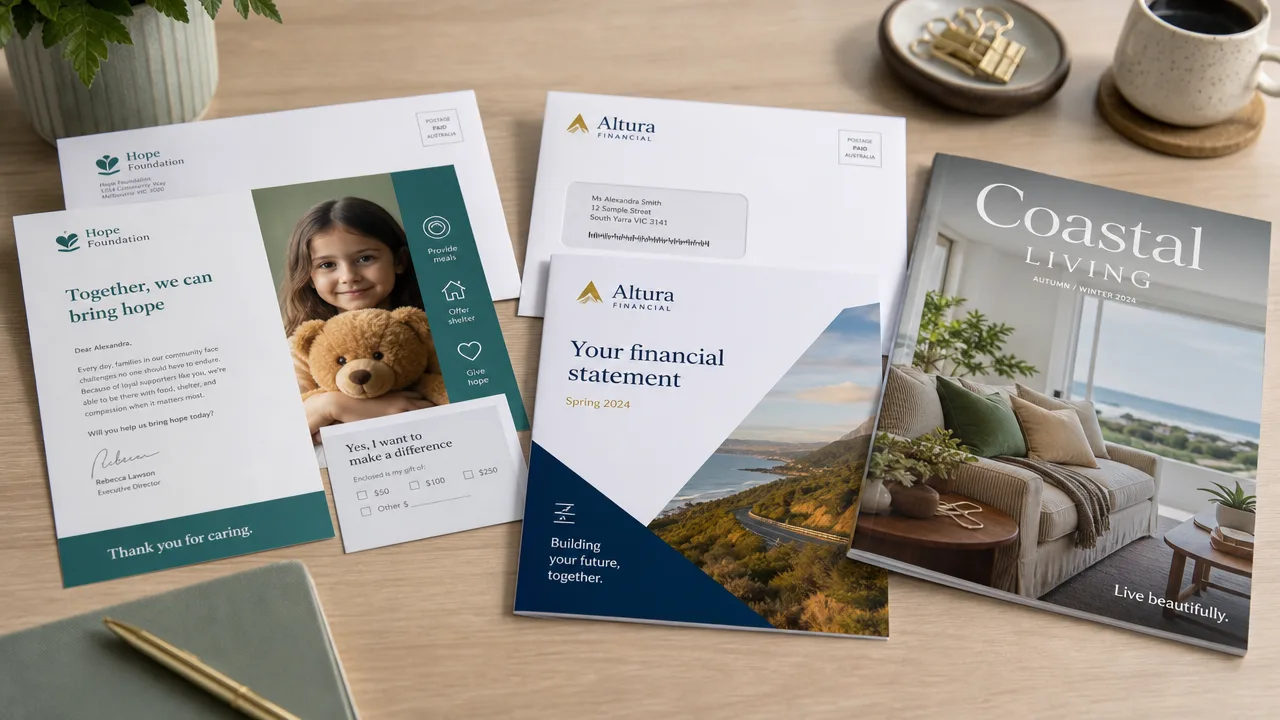
Charities stand out: warm appeals to existing supporters average 11.5%. That is why many charities rely on mail for their core fundraising. See how we helped one national charity lift response from 2.1% to 4.7% across all segments in our charity fundraising case study.
What drives a higher response?
- Audience: the single biggest factor. Mail your best customers or supporters first.
- Format: A4 mailers achieve 2.7 times the response of postcards. In warm retail mail, A4 averaged 9.6%, A5 6.6% and postcards 3.5% (JICMAIL, 2025).
- Objective: mail with both a brand and a response objective saw about five times the response (9.3% against 1.9%).
- Volume: for cold mail, ROI rose with campaign size, from £1.60 (up to 25,000 items) to £2.70 (100,000+ items).
- QR codes: direct mail containing a QR code is 60% more likely to prompt a website visit than the average mail item. For door drops it is 87% (JICMAIL, Q2 2026).
- Personalisation: research for Royal Mail Marketreach found personalised direct mail is read an average of 4.5 times (WARC, 2021).
Beyond response: how people engage with mail
A response rate only counts tracked responses. JICMAIL's household panel of around 1,100 UK homes shows the wider effect of mail:
7.4 days
Average lifespan of a direct mail item in the home
Source: JICMAIL, Q2 2026
4.4
Average number of interactions with each direct mail item
Source: JICMAIL, Q2 2026
9.5%
Mail items that prompted a website visit
Source: JICMAIL, Q2 2026
6%
Mail items that led to a purchase (up from 5% a year earlier)
Source: JICMAIL, Q2 2026
Many people respond to mail through another channel: searching for the brand, visiting the website or walking into a shop. In Q2 2026, 41% of mail-driven purchases were made in-store. This is why matchback, which compares sales against the mailing file, usually shows more value than coded responses alone.
How to calculate your own response rate and ROI
- 1
Response rate
Responses ÷ items mailed × 100. For example, 300 responses from 10,000 letters is a 3% response rate.
- 2
Cost per response
Total campaign cost ÷ responses. For example, a £6,000 campaign with 300 responses is £20 per response.
- 3
ROI per £1
Revenue attributed to the campaign ÷ campaign cost. For example, £24,000 revenue from a £6,000 campaign is £4 back for every £1 spent.
Tip
Agree a matchback window (for example 8–12 weeks) and compare against a holdout group that did not receive the mailing. That shows the true uplift, including people who never used your response code.
For the costs side of the equation, see how much direct mail costs in the UK.
Real results from UK campaigns
| Campaign | Result | Source |
|---|---|---|
| National charity, multi-wave appeal | Response up from 2.1% to 4.7%; fundraising revenue +34% | Fretwell case study |
| Financial services cold acquisition, 500,000 records | 3.8x ROI within 90 days; £18,000 postage saved | Fretwell case study |
| UK retailer, first Republic of Ireland mailing | 5.2% response, the brand's best-ever DM result | Fretwell case study |
| Jaguar Land Rover Defender owners | 89% retained six months after engagement, against a 35% benchmark | Royal Mail Marketreach |
| Connexin broadband door drops and partially addressed mail | Response 1.93%, up from 1.33%; ROI 19:1 | Royal Mail Marketreach |
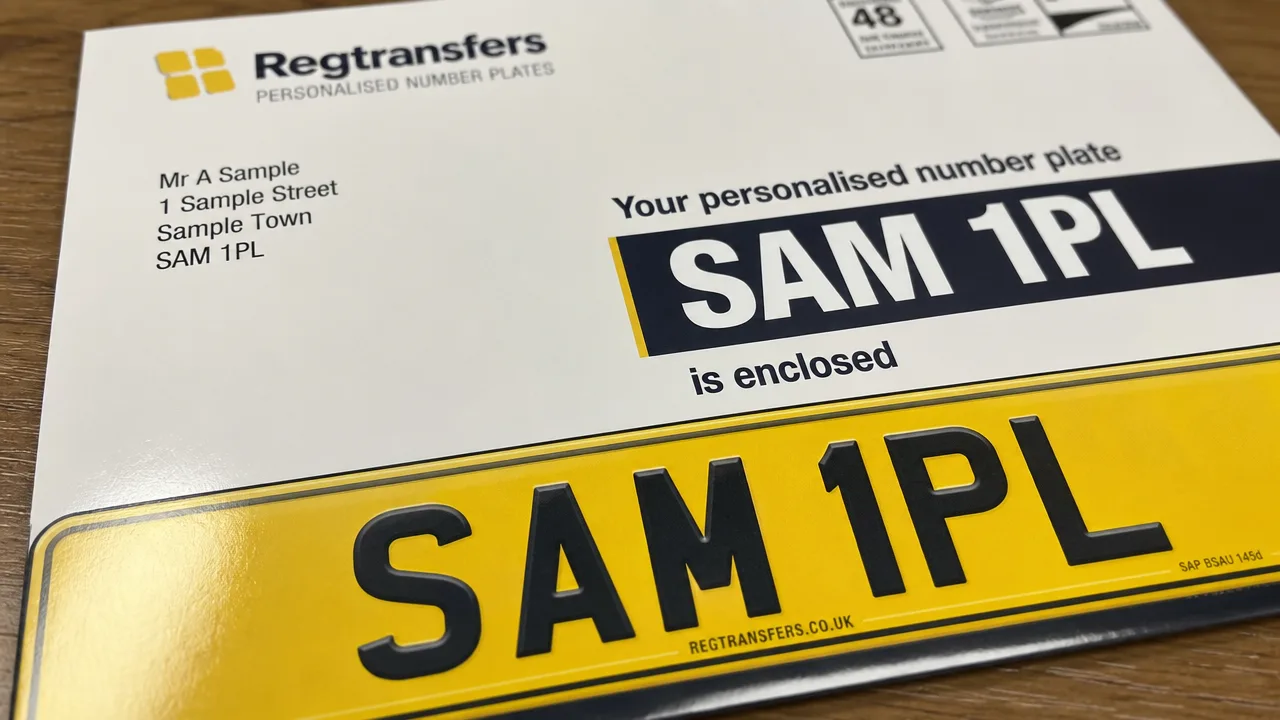
Mailings built to be measured
Unique codes, personalised URLs and QR codes printed in-house, with data returned ready for matchback.
Explore the service